


Aluminum and copper prices: A misleading indicator of industrial demand?

Abstract
The recent rise in aluminum and copper prices is driven by supply constraints and trade uncertainties rather than increased industrial demand. Aluminum prices have surged amid US tariffs and China’s regulatory caps, while copper prices reflect supply disruptions in Chile and front-loading ahead of potential US tariffs. Despite a modest rebound in China’s Manufacturing PMI, this appears seasonal rather than a sign of sustained growth. The price movements of both metals highlight broader economic uncertainties rather than industrial strength.
Aluminium
The recent surge in aluminum futures to $2,720 per tonne might typically be interpreted as a sign of strong industrial activity, particularly in machinery and equipment manufacturing, which generally reflects an expanding economy. Its light weight, corrosion resistance, and high thermal conductivity make it indispensable in industrial applications, including machine bearings, pumps, compressors, and headlamps. However, the current price surge does not reflect heightened demand in these sectors. Instead, manufacturers may face higher input costs, potentially reducing production or shifting to alternative materials where feasible.
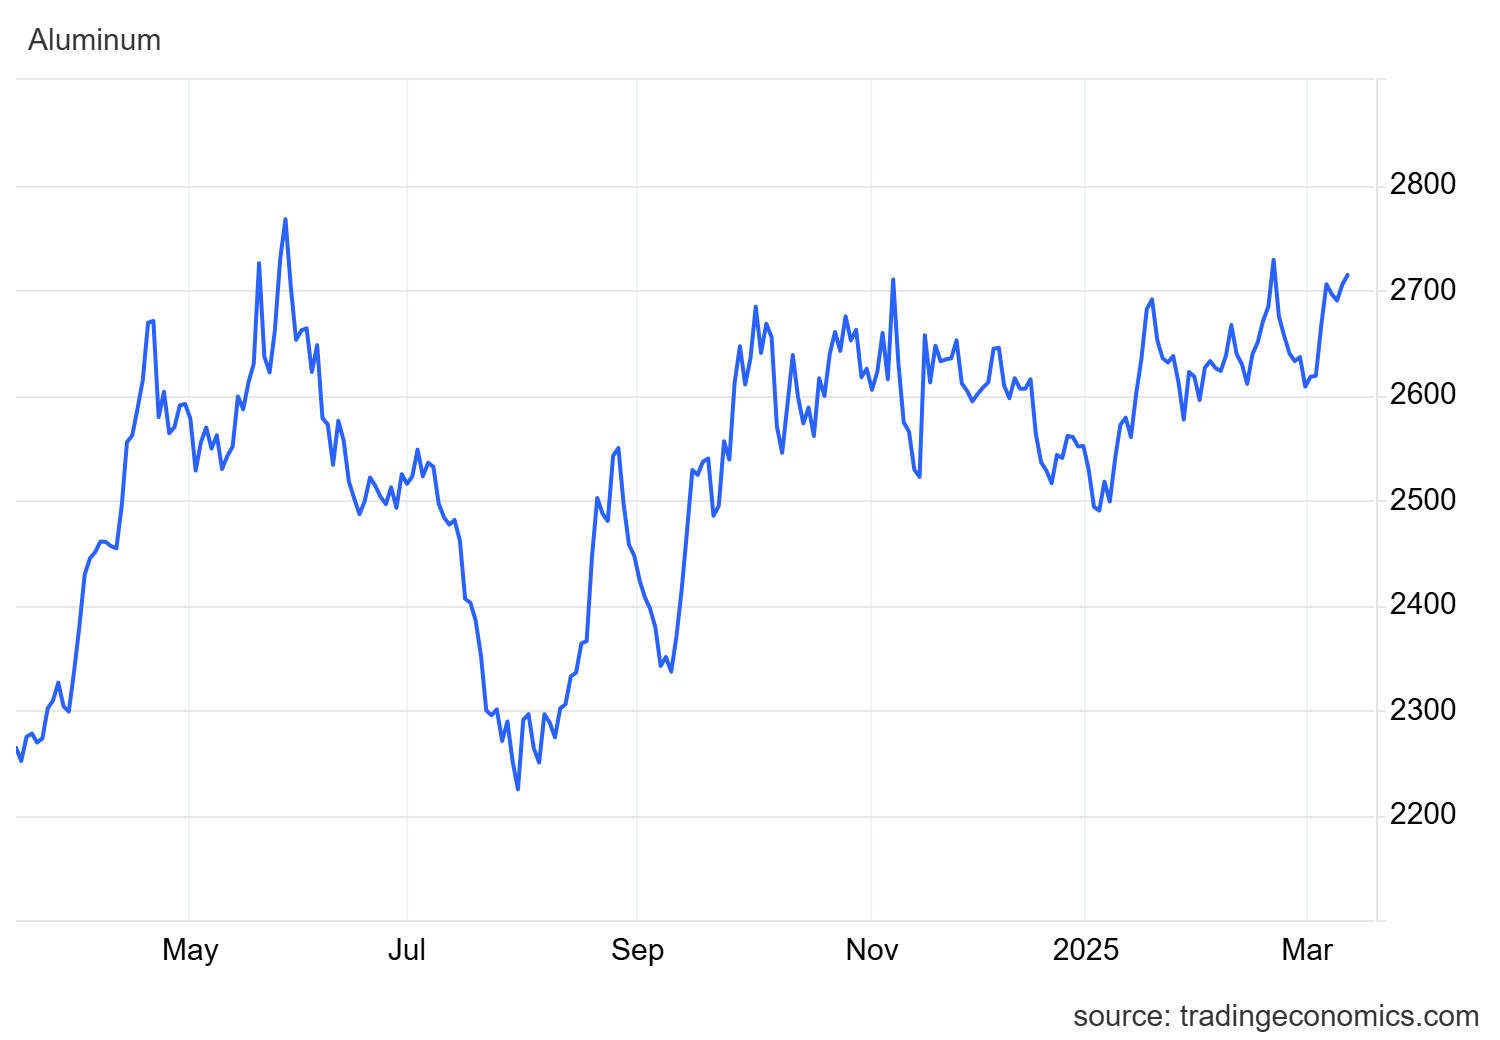
In more detail, this price movement is primarily the result of the United States tariff policies that have come into effect rather than increased industrial demand. The United States recently imposed 25% tariffs on aluminum imports from Canada, Mexico and China, exacerbating supply chain disruptions.
Despite the price increase, the broader industrial outlook remains subdued. The US imports approximately 80% of its aluminum, highlighting its reliance on external supply. This dependence, coupled with tariffs, creates upward pressure on aluminum prices without corresponding increases in demand from industrial sectors. Thus, the price spike should be understood as a consequence of trade barriers and supply constraints rather than a sign of economic acceleration.
Moreover, global aluminum supply faces additional pressures beyond tariffs. China, the world’s largest producer, set a production cap of 25 million tons in 2017 to control excess supply and meet carbon emission targets. However, China produced a record 44 million tons in 2024, suggesting an imminent slowdown in output (going forward). This expected reduction will likely tighten global supply, reinforcing upward price movements.
Moreover, China has recently ended tax rebates (or tax incentives) on aluminum exports, reducing overseas shipments and increasing domestic supply. This policy shift has influenced global price benchmarks, as international markets now face reduced availability of Chinese aluminum. The resulting scarcity, coupled with energy-intensive production processes in other regions, further constrains supply and sustains elevated prices.
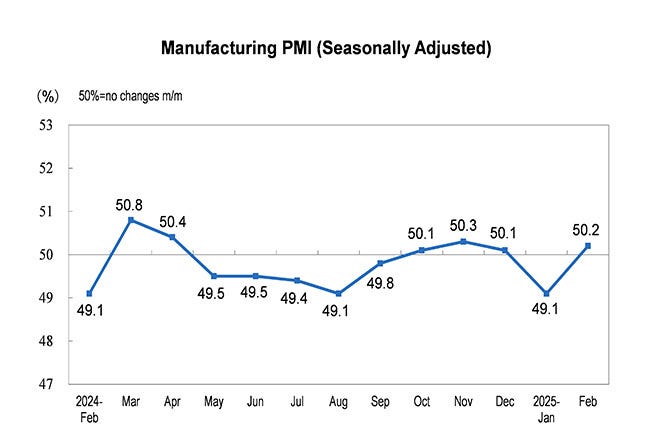
It must be argued, as Reuters pointed out as early as September 2024, that this increase in domestic aluminum production was not a result of rising industrial demand. Moreover, the manufacturing sector in China, as reflected in the Manufacturing Purchasing Managers’ Index (PMI) industry, saw an increase from 49.1 to 50.2 between January and February 2025. However, a closer look reveals two key aspects.
First, the PMI rebound came after a weak January, a recurring trend driven by the seasonal impact of the Lunar New Year holidays. As a result, February’s increase was largely anticipated and does not necessarily indicate sustained growth.
Second, the index remains below the level recorded 12 months ago, when it reached 50.8 (Source: National Bureau of Statistics of China). So, turbulent times ahead…
Copper
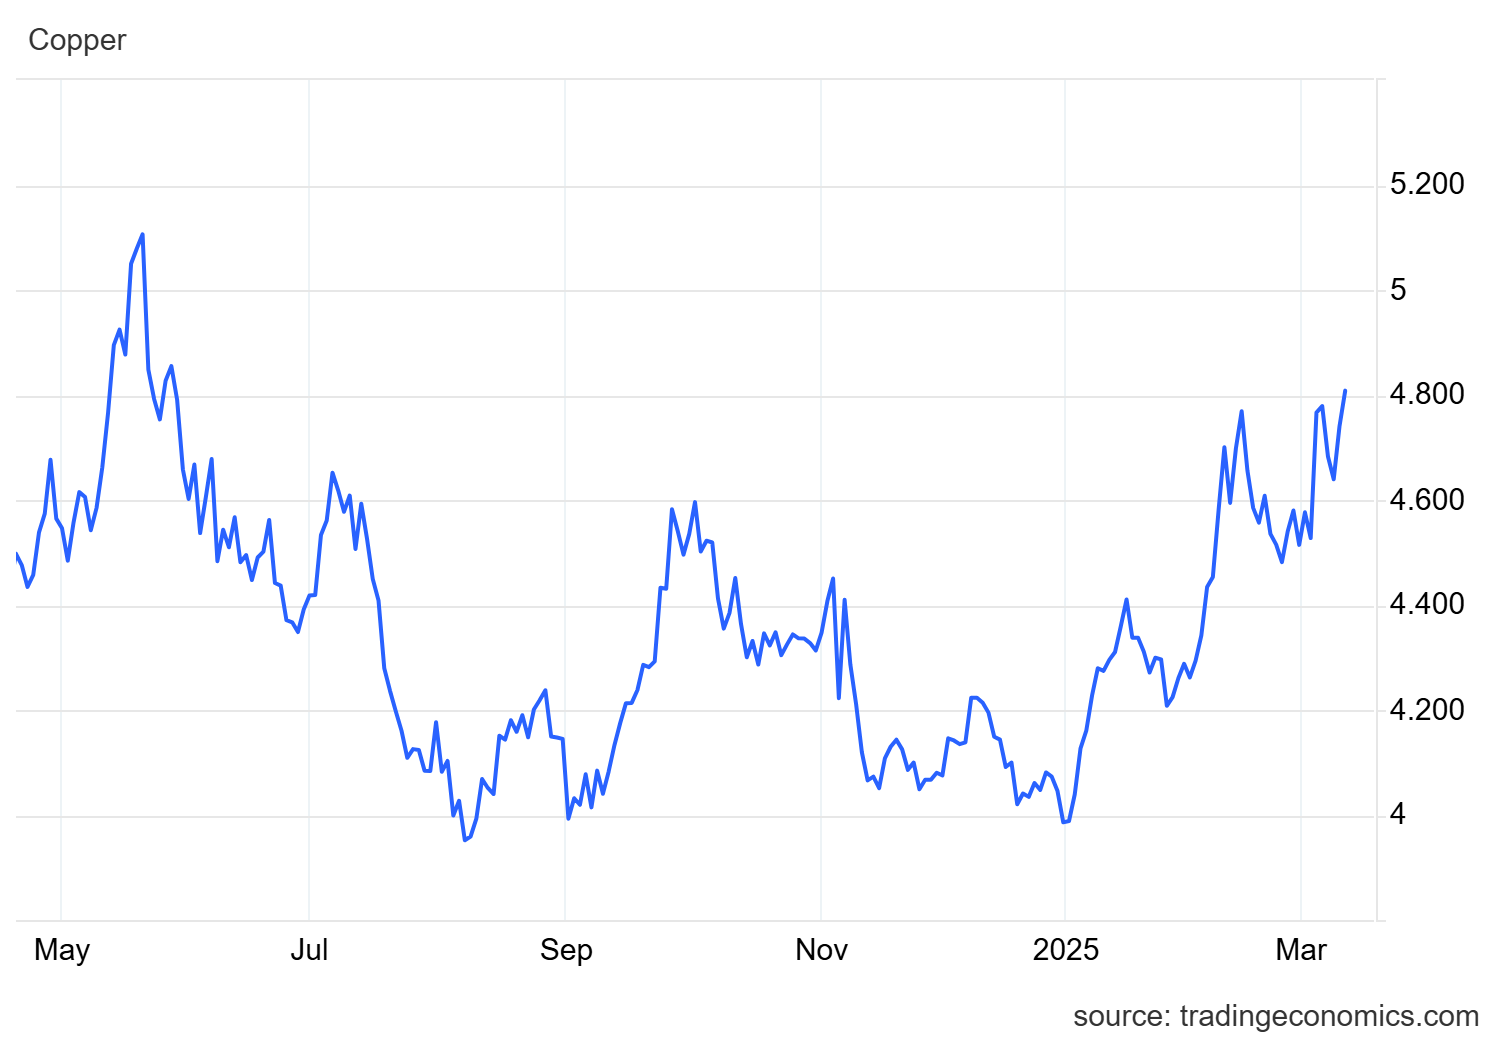
As for copper, it is perhaps an even stronger indicator of manufacturing and industrial demand and production. Typically, a rise in its price signals economic expansion. However, this time is different. The current price increase is driven by multiple factors - none of which necessarily point to a positive economic outlook.
One key factor is the decline in Chile’s copper production, which fell by 2.1% year-on-year to 426,900 tonnes in January 2025 (with Chile being the world's largest producer). Another crucial factor is the uncertainty surrounding copper tariffs and their potential impact on industrial production in the United States. This stems from the fact that the US relies heavily on copper imports, with more than half of its supply coming from abroad.
Moreover, this uncertainty has led to a front-loading effect, as physical traders have been purchasing copper and exporting it to the US ahead of the tariff implementation. This has further contributed to the rise in copper prices, without a corresponding increase in industrial production.
Conclusion
The recent surges in aluminum and copper prices should not be interpreted as signs of robust industrial demand or economic growth. The aluminum price hike is largely driven by US tariff policies and supply chain disruptions, rather than increased industrial activity. Similarly, the copper price rise is influenced by production declines in key regions like Chile and tariff uncertainties, rather than a clear expansion in manufacturing or economic activity. These price movements reflect supply constraints and trade barriers, signaling more challenges ahead for global markets, rather than sustained economic acceleration.